Philly for Great Public Schools 2026 Education Poll
A new survey of 1,029 registered voters in Philadelphia shows that strong dissatisfaction with the state of public education in the city is even higher than in a similar poll conducted in May 2025. Voters want to see significant changes to the city’s education system, including improvements to school facilities and allowing public charter schools to accept more students.
Perceptions of the state of public education in Philadelphia have worsened since May 2025.
In the May 2025 survey, 44% said they were very concerned about the state of public education in the city, while 57% said the same in the new survey–a 13-point increase. Overall, 81% are now at least somewhat concerned, up 4 points from a year ago.
Additionally, 28% perceive the conditions of public school facilities as “very poor,” up from 21% a year ago. The number who see school facilities as simply “poor” has remained steady, at 34%.
As in last year’s survey, voters want to see the Mayor more engaged on education issues: 58% want her to be more engaged, similar to the 59% who said the same a year ago.
Voters are very concerned about the state of public education in the city.
Overall, 81% are concerned about the state of public education, including 57% who are very concerned. This strong concern is especially pronounced among Latinos and African Americans. Additionally, a majority of voters in every region of the city are very concerned.
These numbers are more negative than in a survey conducted a year earlier, in which 77% said they were concerned. In that survey, 44% were very concerned, meaning that strong concern has increased by 13 percentage points over the past year.
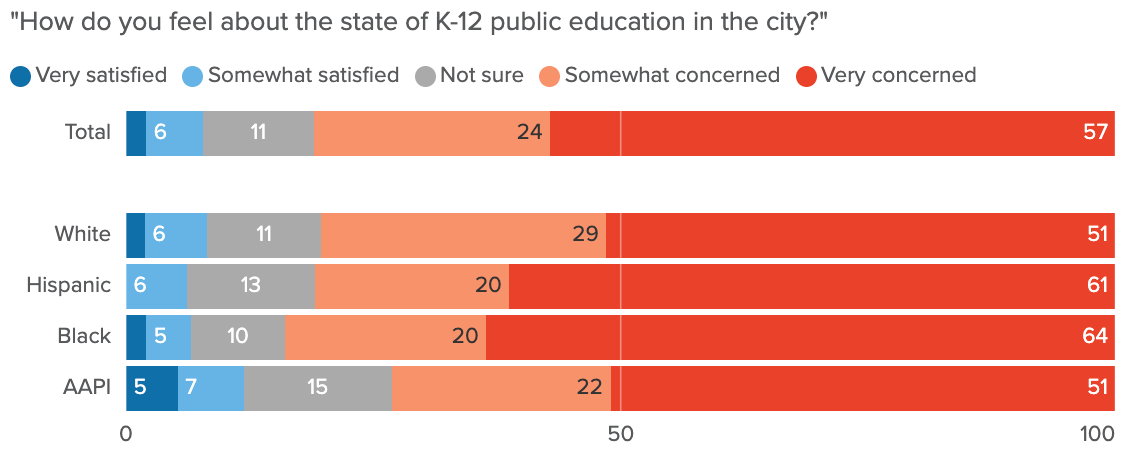
On a separate question, only 8% said that public education in Philadelphia was headed in the right direction, while 59% said it was headed in the wrong direction.
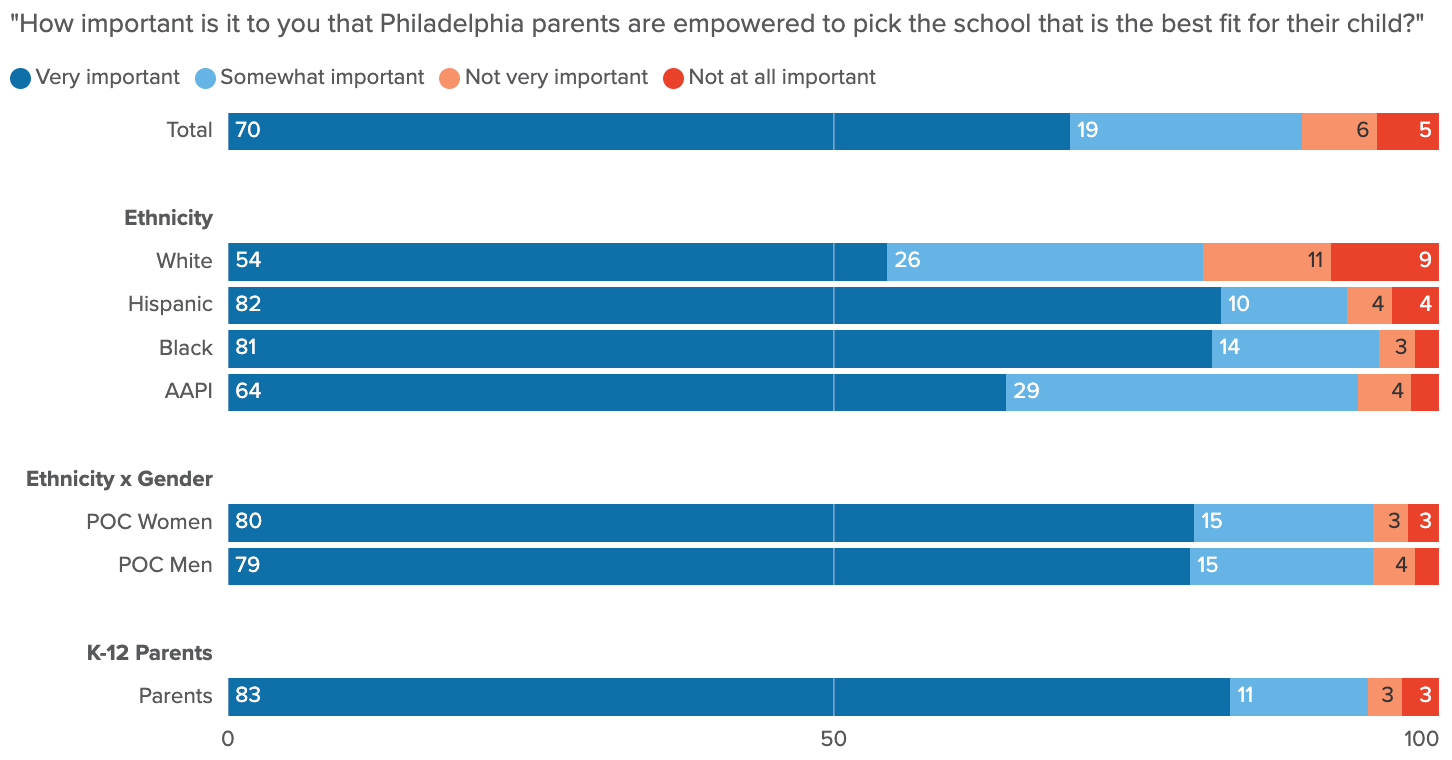
Philadelphians overwhelmingly want parents to be empowered to pick the best school for their child.
Overall, 89% say empowering parents to pick their children’s school is important, including 70% who say it’s very important. Agreement is especially strong among parents and all people of color, with about 8 in 10 of each saying it is very important. Notably, POC men and women are equally adamant about the importance of empowering parents to pick their kids’ school.
Geographically, over 2 in 3 voters in every region of the city say it is important for parents to pick their children’s school, with especially high numbers in the northern and western parts of the city, where at least 9 in 10 say so.
These numbers are nearly identical to the numbers from a year ago.
Majorities of people of color and parents support allowing new charter schools to open in Philadelphia.
Among parents, 63% support allowing new charter schools to open. Support is nearly as high among African Americans, with 61% supporting new charter schools and only 24% opposed. A majority of Latinos, 54%, are also supportive. Support is also especially high among those without a college degree, at 61%. Among all voters, 49% support new charter schools, while 32% oppose.
Support is highest in northeast Philadelphia, where 61% are supportive while 26% oppose. In North Philadelphia, West Philadelphia, and the southwestern part of the city, half of voters are supportive, while about 3 in 10 are opposed.
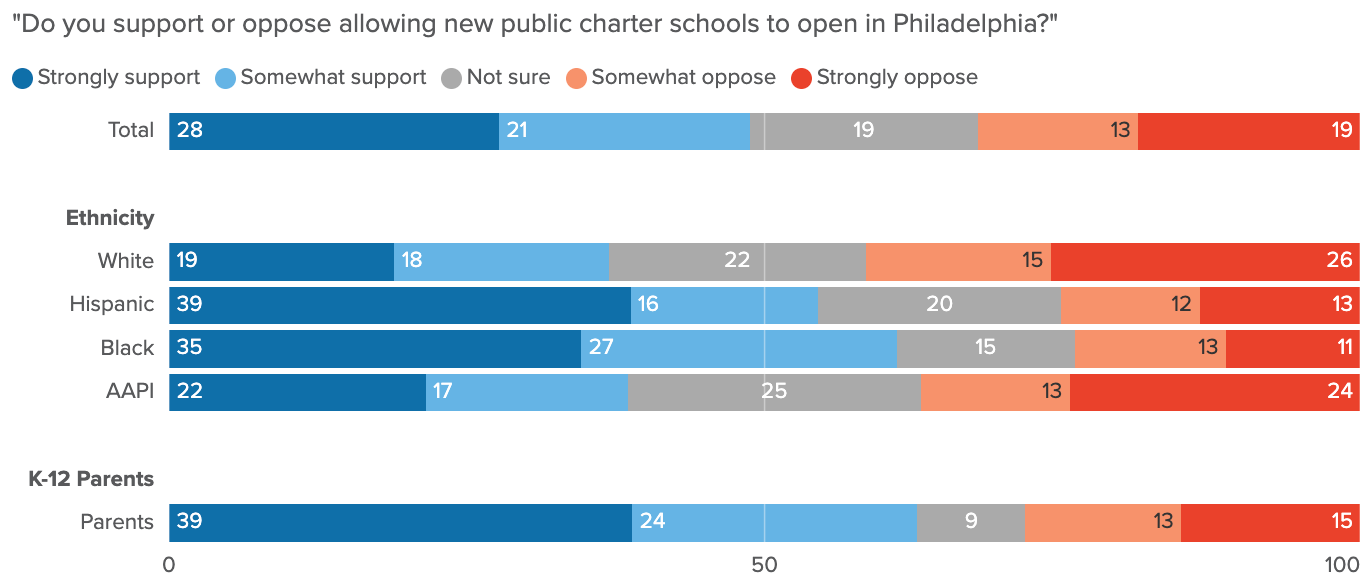
After respondents read that more than half of the 25,000 applicants for charter schools were placed on waitlists due to insufficient seats, support for approving new charter schools in the city rose to 53%, with the increase entirely being composed of strong support. Here, support is again highest in the northeast, where 64% support.
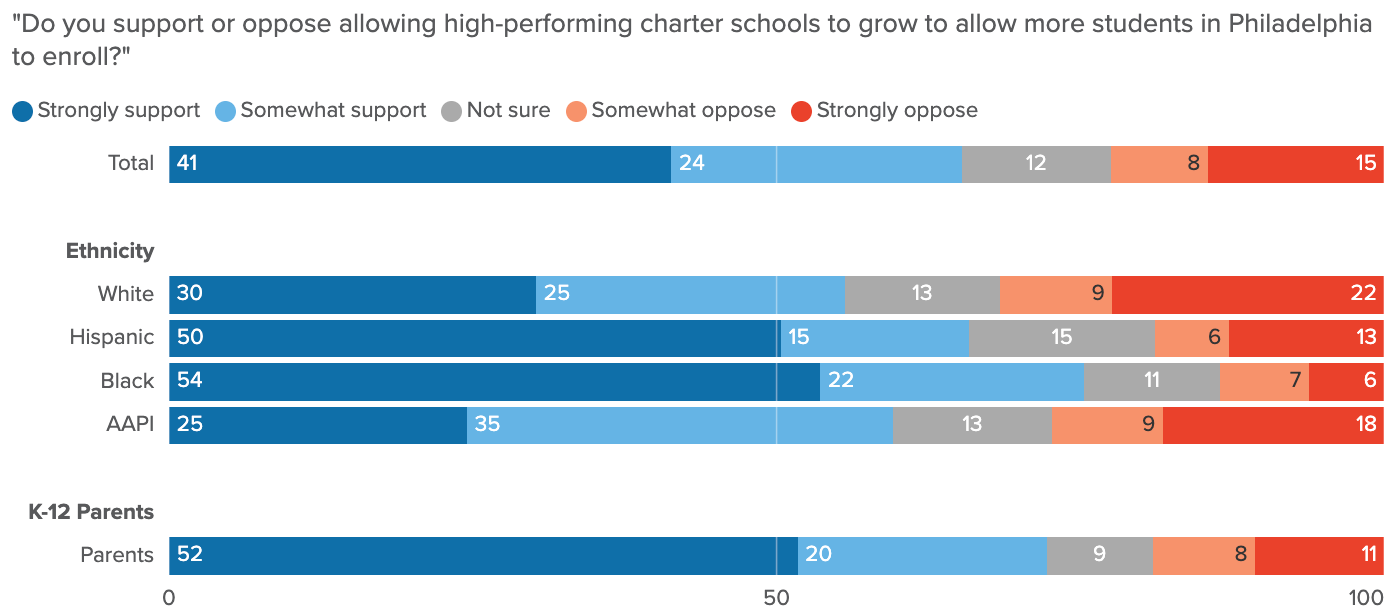
2 in 3 voters support allowing high-performing charter schools to grow.
Overall, 65% of respondents support allowing high-performing charter schools to enroll more students. Again, support is higher among parents and people of color: 72% of parents, 75% of African Americans, 66% of Latinos, and 60% of Asian Americans support allowing charter schools to grow. And men and women of color are almost equally supportive, at 71% and 72%, respectively. Additionally, a majority of parents, Latinos, and African Americans strongly support allowing this growth.
A majority of every region of the city support allowing these schools to grow. Support is especially high in northwestern Philadelphia (70%). In the west, northeast, southwest, and northern parts of the city, too, at least 65% are supportive.
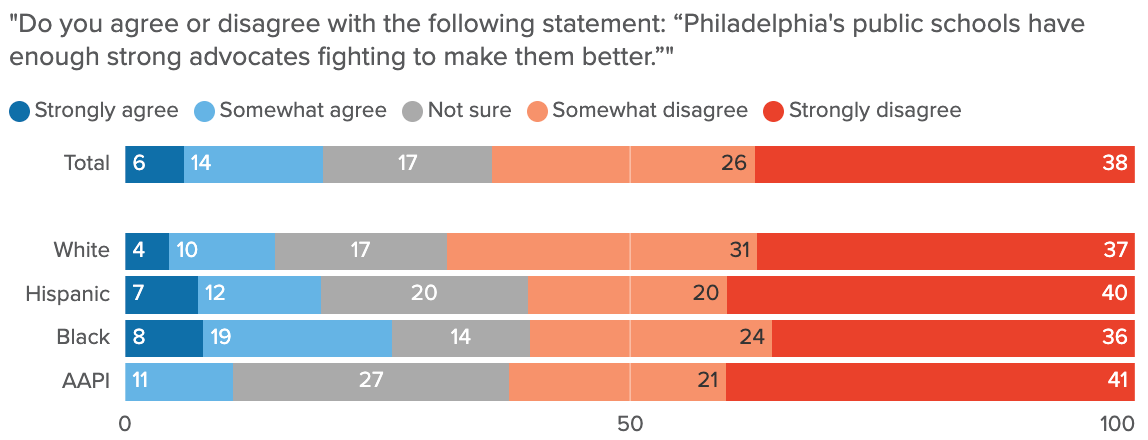
Voters want to see more advocates fighting to improve the city’s public schools.
Just 20% believe there are currently enough strong advocates, only 6% strongly. Meanwhile, 64% disagree, including at least 6 in 10 voters of every major racial and ethnic background. Across every region of the city, a majority of respondents disagree that there are enough strong advocates fighting to improve public schools, with especially high disagreement in the northeast (73%) and center city (70%).
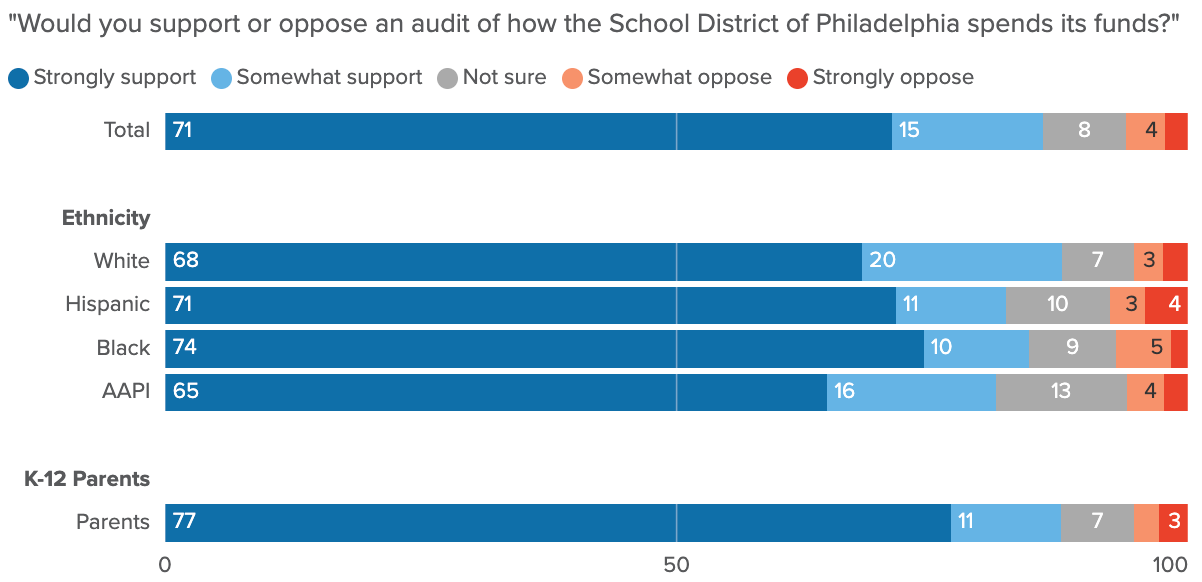
Voters overwhelmingly support an audit of district spending.
Among all respondents, 86% support an audit, including 71% who strongly support it, while just 6% are opposed. Support is strongest among parents (77% strongly support), African Americans (74% strongly support) and Latinos (71% strongly support). Support is high across the city, with over 8 in 10 in each region supporting, including at least 2 in 3 who strongly support.
ADDITIONAL FINDINGS
- Overall, 66% of respondents would either consider sending their children to charter schools or already do so. This is higher than the 61% who would or already do send their children to public district schools, while 73% would or do send their children to private schools.
- Only 5% of respondents rate the condition of Philadelphia’s public school facilities as excellent or good, while 34% rate them as poor, and 28% rate them as very poor.
- 30% support the early May vote to close 17 public schools and modernize 169 others, while 52% oppose it.
METHODOLODY
Change Research surveyed 1,029 registered voters in Philadelphia from May 27-June 3, 2026. We used the following sources to recruit respondents:
- From targeted advertisements on Facebook and Instagram, as well as across the web via Facebook's ad platform (431 respondents)
- From text messages sent, via the Echo19 platform, to cell phone numbers listed on the voter file for individuals who qualified for the survey’s sample universe, based on their voter file data (598 respondents)
Regardless of which source a respondent came from, they were directed to a survey hosted on Surveymonkey’s website.
Ads placed on social media targeted adults in Philadelphia. Those who indicated that they were not registered to vote were terminated. As the survey fielded, Change Research used dynamic online sampling: adjusting ad budgets, lowering budgets for ads targeting groups that were overrepresented, and raising budgets for ads targeting groups that were underrepresented, so that the final sample was roughly representative of the population across different groups. The survey was conducted in English.
The survey was commissioned by Philly for Greater Public Schools, and conducted online by Change Research. Post-stratification was performed on age, gender, race/ethnicity, and 2024 presidential vote. Weighting parameters are based on the demographic composition of registered voters in the city, based on voter file data. That is, if x% of registered voters in the city were women, women would be weighted to x%. 2024 presidential election data was sourced from the Pennsylvania Secretary of State.
The modeled margin of error* for this survey is 3.1%, which uses effective sample sizes** that adjust for the design effect of weighting. This research, like all public opinion research, does entail some additional unmeasured error.
* We adopt The Pew Research Center's convention for the term "modeled margin of error"(1) (mMOE) to indicate that our surveys are not simple random samples in the pure sense, similar to any survey that has either non-response bias or for which the general population was not invited at random. A common, if imperfect, convention for reporting survey results is to use a single, survey-level mMOE based on a normal approximation. This is a poor approximation for proportion estimates close to 0 or 1. However, it is a useful communication tool in many settings and is reasonable in places where the proportion of interest is close to 50%. We report this normal approximation for our surveys assuming a proportion estimate of 50%.
** The effective sample size adjusts for the weighting applied to respondents and is calculated using Kish's approximation (2).
(2) Kish, Leslie. Survey Sampling, 1965.